OpenAI’s language model, ChatGPT, has just rolled out one of its most significant updates ever. The new feature, Advanced Data Analysis formerly known as “Code Interpreter”, is currently available to all ChatGPT Plus subscribers. This blog post will guide you through this new and exciting update, demonstrating its capabilities and how you can use it within ChatGPT.
Advanced Data Analysis: An Overview
The new update is aptly named Advanced Data Analysis formerly called “Code Interpreter”. Although the name might suggest that it only interprets code, the reality is that this feature can analyze a wide variety of file types. From text files to other data-rich documents, the Advanced Data Analysis is built to provide in-depth insights and analyses.
Understanding the Subscription Model
To access the Advanced Data Analysis, you need to be a ChatGPT Plus subscriber. If you haven’t subscribed yet, the capabilities of this new update might convince you to get the subscription.
The Power of ChatGPT Advanced Data Analysis
The Advanced Data Analysis can do much more than just interpret code. It can read and analyze text files, providing significant trends and insights. Whether you need to understand complex data or simply want to extract key points from a document, the Code Interpreter is up to the task.
Let’s delve into the details and discover how Advanced Data Analysis can revolutionize your experience with ChatGPT.
1. Analyzing Data:
With Advanced Data Analysis, ChatGPT transforms into your personal data analyst. By simply uploading data files such as CSVs or text documents, you can request an analysis of the data contained within. ChatGPT will provide you with insights, breakdowns of columns and rows, and even visualize the data trends.
Prompt: “Describe the Data”
2. Creating Visuals:
Advanced Data Analysis is capable of generating an array of visual elements, from graphs to diagrams. By prompting ChatGPT to create visuals based on your data, you can gain a better understanding of the information at hand. This feature is especially useful for representing data in presentations or reports.
Visual Chart
Prompt: “Create a bar chart”
Word Cloud
Prompt: “Create a Word Cloud”
3. Image Processing:
Advanced Data Analysis expands beyond text and data files and supports image processing tasks. You can upload images and instruct ChatGPT to perform various actions, such as cropping, resizing, or even converting images to different formats like black and white.
Original Image
Processed Image
Prompt: “Make it Black and White”
4. File Conversion:
Need to convert a file from one format to another? Advanced Data Analysis has got you covered. Whether it’s transforming an MP4 video into a GIF or converting a JPEG image to a PNG, ChatGPT can handle various file conversion tasks.
Prompt: “Convert Video to gif Format”
5. QR Code Generation:
Advanced Data Analysis can also generate scannable QR codes. You can simply request a QR code that directs users to a specific website or URL, making it convenient for sharing links or information.
Prompt: “Create a QR Code for” https://usingai.pro
6. Financial Data Analysis:
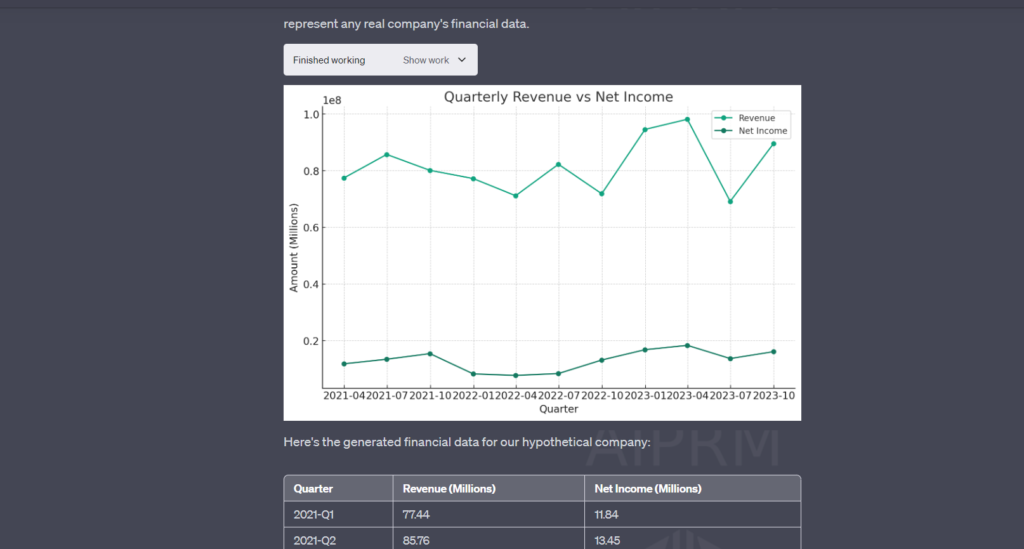
With Advanced Data Analysis, you can easily analyze financial data. Whether it’s stock prices, sales figures, or revenue estimates, ChatGPT can break down the data and provide visual representations, such as graphs or histograms, to help you gain insights.

Prompt: “Using a machine learning model, predict the next quarter’s revenue and net income for the hypothetical company based on the historical data provided. Please generate the data, plot it, and explain the insights you can glean from it”
7. Making Predictions:
ChatGPT’s Advanced Data Analysis has the potential to make predictions based on the data you provide. While this functionality is still being refined, it holds promise for forecasting trends or outcomes within the scope of the data set.

Prompt: “Make Predictions for the Next four quarters”
8. Interacting with Your Own Data:
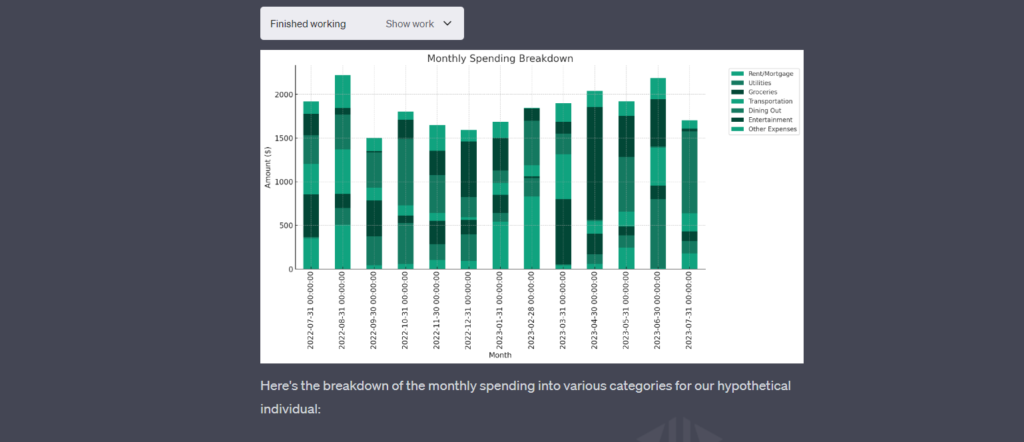
One of the most impressive aspects of Advanced Data Analysis is the ability to interact with your own data sets. You can upload your own files, scripts, or documents and prompt ChatGPT to analyze, visualize, or summarize the data within them. This feature empowers users to perform data analysis without extensive technical skills.

Prompt: “Provide a breakdown of the monthly spending into various categories and plot it into a bar chart”
9. Analyzing and Optimizing Code:
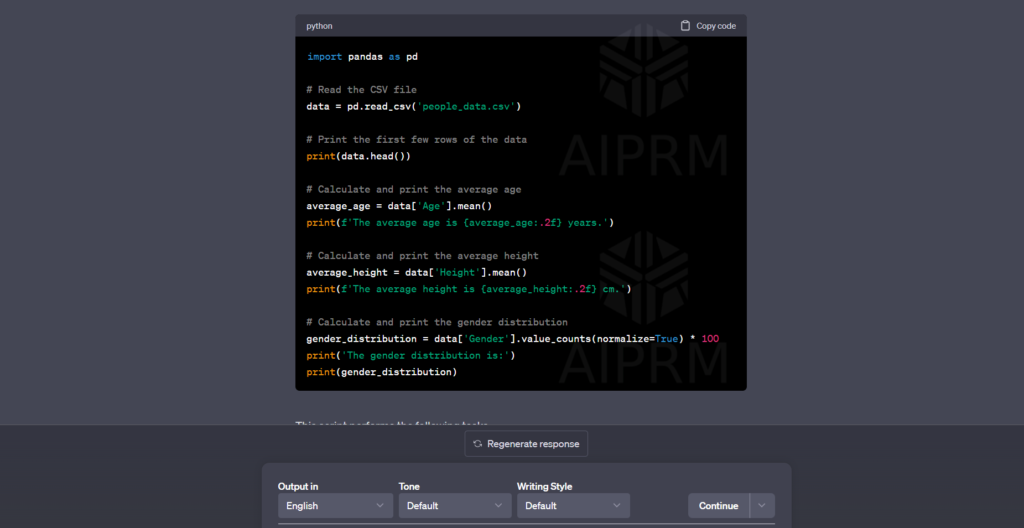
For developers, Advanced Data Analysis provides a valuable tool for code analysis and optimization. It can explain the purpose of the code, list modules, find errors, suggest improvements, and even generate code examples. This functionality enables developers to streamline their coding process and improve efficiency.

Prompt: “Describe this script”
10. Creating Presentations:
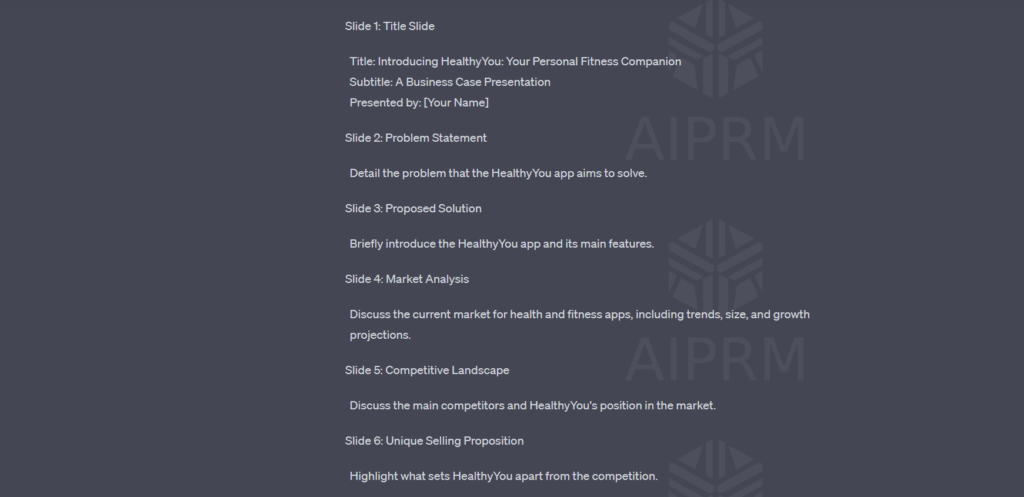
Advanced Data Analysis makes it possible to create entire presentations with ease. By instructing ChatGPT to generate visuals and slides based on your data, you can quickly assemble a comprehensive presentation without the need for manual creation. This feature is highly advantageous for showcasing data-driven insights.

Prompt: “Provide an outline for a presentation based on this case study”
ChatGPT Code Interpreter Prompt List
We’ve compiled over 100+ prompts designed to assist you in utilizing the powerful features of ChatGPT’s Advanced Data Analysis. Whether you’re a developer, data analyst, or a regular user without technical skills, this prompt list offers a wide range of practical examples and resources to leverage the full potential of ChatGPT’s Advanced Data Analysis. From data analysis and visualization to image editing, file conversion, code analysis, and more, these prompts provide a comprehensive toolkit for interacting with code and achieving various tasks. Explore the possibilities and unlock new capabilities with the ChatGPT Advanced Data Analysis Prompt List.
Task description prompts for Analyzing Data
| Task Description | Prompt |
| Load and preview the data | Can you load and preview the data? |
| Describe the data | Can you describe the data? |
| Explain this dataset in one paragraph | Can you explain this dataset in one paragraph? |
| Explain this dataset in simple terms | Can you explain this dataset in simple terms? |
| Explain this dataset like I’m 5 years old | Can you explain this dataset like I’m 5 years old? |
| Identify the main takeaway | What’s the main takeaway from this dataset? |
| Describe the rows and columns | What are the rows and columns in this dataset? |
| Provide insights | What insights do you see here? Give me a numbered list. |
| Create a graph | Can you create a graph using this data? |
| Create a chart | Can you create a chart using this data? |
| Create a heatmap | Can you create a heatmap using this data? |
| Identify trends | What are the trends shown in this data? |
| Top 10 points | Can you list the top 10 key points? |
| Turn into Article | Can you write me an article based on this dataset? |
| Quick recap | Can you write a one-sentence recap of this data? |
| Clean Data | Can you clean this dataset? |
| Segment Data | Can you segment this data and create a table? |
| Create a presentation | Can you create a presentation based on this dataset? |
| Create 10 visuals | Can you create 10 visuals to represent different data? |
| Word Cloud | Can you create a visual word cloud? |
| Beautify the graphs | Can you make the graphs more beautiful? |
| Visual Chart | Create a visual chart based on this data. |
| Trends in a visual format | Show me the top trends in a visual format. |
| Key Lessons | What is the key lesson from this dataset? |
Task description prompts for analyzing financial data
| Task Description | Prompt |
| Load and preview the data | Can you load and preview the data? |
| Describe the data | Can you describe the data? |
| Plot the closing price | Can you plot the closing price? |
| Find the date with the highest closing price | What’s the date with the highest closing price? |
| Calculate the percentage change | Can you calculate the daily percentage change? |
| Calculate moving averages | Can you calculate a 7-day moving average? |
| Create a candlestick chart | Can you create a candlestick chart? |
| Find the largest single day gain and loss | What’s the largest single day gain and loss? |
| Analyze volume | Can you analyze the volume? |
| Check for seasonality | Can you check for seasonality? |
| Compare price with volume | Can you compare the closing price with volume? |
| Calculate volatility | Can you calculate the price volatility? |
| Decompose the time series | Can you decompose the closing price time series? |
| Test for stationarity | Can you test for stationarity using the Augmented Dickey-Fuller test? |
| Autocorrelation and partial autocorrelation plots | Can you show the autocorrelation and partial autocorrelation plots? |
| Implement a time series model | Can you implement an ARIMA model to predict future prices? |
| Plot Bollinger Bands | Can you plot Bollinger Bands? |
| Find important dates | Can you identify dates of significant changes in volume or price? |
| Plot a histogram of the daily returns | Can you plot a histogram of daily returns? |
| Rolling window operations | Can you perform a rolling sum over a 7-day window? |
| Price Increase | What’s the duration of the fastest price increase from low to high? |
| Price Decrease | What’s the duration of the fastest price decrease from high to low? |
Task description prompts for image editing and alteration
| Task Description | Prompt |
| Identify the main colors and objects | Can you identify the main colors and objects in the image? |
| Change brightness/contrast | Can you change the image with filters, brightness/contrast adjustments? |
| Resize Image | Can you resize the image to a specified pixel dimension while keeping its shape the same? |
| Read Metadata | Can you look at the image’s metadata like when it was created or last changed? |
| Figure out the image’s aspect ratio | Can you figure out the image’s aspect ratio? |
| Compare Images | Can you compare this image with another one for similarities or differences? |
| Change Color Scheme | Can you change the image’s color scheme from RGB to grayscale? |
| Break down the image | Can you break the image down into its separate parts or objects? |
| Use edge detection to find boundaries | Can you use edge detection to find the boundaries in the image? |
| Examine the image’s texture | Can you examine the image’s texture for use in image processing tasks? |
| Resize Image | Can you resize the image to specific dimensions? |
| Crop for vertical format | Can you crop this image to a vertical format of 1080×1920? |
| Crop to square format | Can you crop this image to a square format of 1080×1080? |
| Crop without distorting aspect ratio | Can you crop the image without distorting its aspect ratio? |
| Convert to black and white | Can you convert this image to black and white? |
| Enhance resolution | Can you enhance the image quality using sharpening techniques? |
| Apply filters | Can you apply artistic effects to the image, such as an oil painting effect? |
| Overlay text onto the image | Can you overlay text onto the image? |
| Flip or rotate the image | Can you flip or rotate the image? |
| Apply a watermark to the image | Can you apply a watermark to the image for copyright protection? |
| Transform the photo into a color palette | Can you transform this photo into a color palette and export it as a PNG? |
Task description prompts for converting file types
| Task Description | Prompt |
| Convert to MP3 | Can you change this song to MP3 format? |
| Convert to SRT | Can you convert this text to an SRT file (subtitles)? |
| Convert WAV to MP3 | Can you convert this WAV file to MP3 format? |
| Convert PNG to JPEG | Can you convert this PNG image to JPEG format? |
| Convert MP4 to GIF | Can you convert this MP4 video into a GIF format? |
Task description prompts for analyzing code
| Task Description | Prompt |
| Explain the code | Can you explain this code? |
| Identify the key purpose | What is the key purpose of this code? |
| Suggest improvements | Can you review the code and suggest improvements? |
| Extract functions | Please extract all the function definitions from the code. |
| List modules | Find and list all the imported modules in the code. |
| Run specific functions | If applicable, can you run specific functions or methods in the code? |
| Analyze for errors | Analyze the code for potential errors or inefficiencies. |
| Modify the code | Make modifications to the code (e.g., implement a new function, adjust existing logic). |
| Explain specific sections | Explain what specific sections or lines of code are doing. |
| Test the code | Test the code with different input parameters. |
| Create a flowchart | Create a flowchart or diagram to visualize the code execution. |
| Explain any classes | Identify and explain any classes and their methods in the code. |
| Check against guidelines | Check if the code follows PEP8 style guidelines. |
| Find potential errors | Identify the lines of code that are most likely to throw exceptions. |
| Identify security issues | Identify any potential security issues in the code. |
| Identify dependencies | Identify the dependencies of this script. |
| Provide time estimate | Provide an estimate of how long the script will run with certain inputs. |
| Suggest improvements | Suggest ways to optimize or refactor the code for better performance or readability. |
| Create a test | Create a unit test for a specific function or method. |
| Identify main algorithm(s) | Identify the main algorithm(s) used in the code and explain how they work. |
| Explain data structures | Explain any complex data structures used in the code. |
| Identify potential multithreading | Identify any potential multithreading or multiprocessing opportunities. |
Conclusion:
Code Interpreter is a game-changing update for ChatGPT, offering a plethora of functionalities to enhance your experience. From data analysis and visualization to image processing and code optimization, ChatGPT becomes a versatile tool for various tasks. Whether you’re a data analyst, developer, or non-technical user, Code Interpreter provides valuable features that can simplify and accelerate your workflow. Explore the possibilities and unleash the full potential of ChatGPT with Code Interpreter.

